Measures to Fight Climate Change -Information Disclosure Based on TCFD Recommendations-
The Financial Stability Board's Task Force on Climate-Related Financial Disclosures (TCFD) asks all companies to assess climate-related risks and opportunities using climate change scenarios and disclose them in their business strategies and risk management. The Kyocera Group endorses the TCFD recommendations and has established a governance structure, strategy, risk management, and setting metrics and targets as part of efforts to promote these initiatives.
In 2018, the Kyocera Group recognized the implementation of climate change countermeasures as a priority issue and set long-term environmental targets based on the assumption of a temperature rise of 2.0℃. In 2021, the Group revised its long-term environmental targets based on the assumption of a temperature rise of 1.5℃, aiming for a 46% reduction of Scope 1 and 2, and Scope 1, 2 and 3 by FY2031 (compared to FY2020), and carbon neutrality by FY2051.
To achieve these long-term environmental targets, the Group has been actively implementing renewable energy and energy-saving measures at each operation site, and continues working on a wide variety of countermeasures against global warming.
Governance
Climate change ranks among the Kyocera Group's key management priorities. Our Sustainability Committee meets semiannually with top management to determine climate change countermeasures and goals. Sustainability progress is reported to the Board of Directors and shared during semiannual International Management Meetings attended by the leaders of our global operations. In addition, we have established a Long-Term Environmental Targets Task Force under the auspices of the Sustainability Committee to oversee tactical implementation.
Strategy
The Kyocera Group analyzes risks and opportunities posed by climate change to the Kyocera Group in consideration of the impact of climate change on the Company's business, and changes in customer industries for FY2031 using an 1.5°C scenario*1 and a 2.6°C scenario*2 based on information provided by the IPCC (Intergovernmental Panel on Climate Change). In particular, due to the importance that trends toward decarbonization plays in Kyocera's renewable energy business, energy adoption patterns and other considerations set under the 1.5°C scenario were applied, and the financial impact of risks and opportunities for each pattern were evaluated and analyzed. Based on these analysis results, we aim to achieve our greenhouse gas emission reduction targets for by FY2031, and achieve carbon neutrality by FY2051.
- Scenario where temperatures rise between 1.0 and 1.8°C in 2100 compared to average global temperatures compared to pre-industrial levels (IPCC Sixth Assessment Report: SSP1-1.9)
- Scenario where temperatures rise between 2.1 and 3.5°C in 2100 compared to average global temperatures compared to pre-industrial levels (IPCC Sixth Assessment Report: SSP2-4.5)
Scenario
| Scenario | Overview |
|---|---|
| 1.5℃ |
A rise of +1.0 to 1.8°C in 2100 compared to the pre-industrial levels 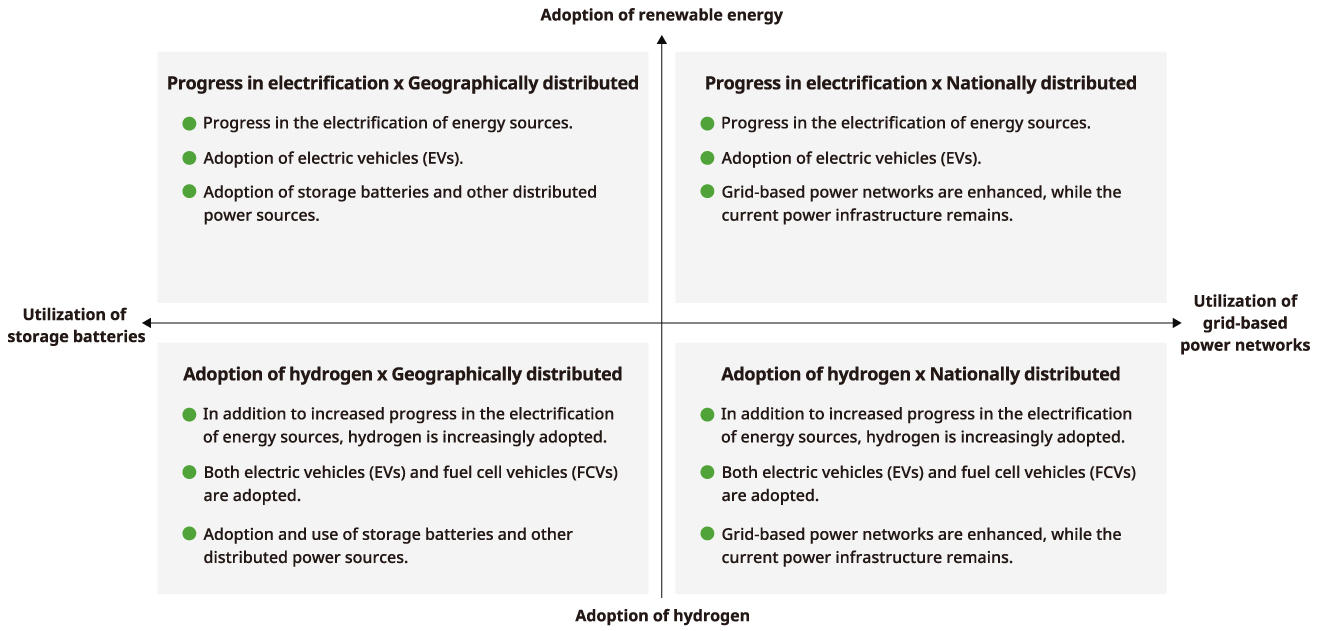
|
| 2.6℃ | A rise of 2.1 to 3.5°C in 2100 compared to the pre-industrial levels |
Main references:
RCP8.5, RCP4.5, RCP2.6, IEA ETP 2DS, IEA ETP B2DS, IEA450, IEA NPS, IEA NZE2050, IEA Sustainable Development Scenario, WRI Aqueduct Water Risk Atlas, Practical Guidelines on Flood Mitigation Planning in Consideration of Climate Change, etc.
Assessment of Business Impact
Items of major importance were assessed for their impact on the business. Although the business was forecast to suffer major impacts from flooding damage under the 2.6°C scenario, while under the 1.5°C scenario, the business was expected to be deeply impacted by carbon prices, and Kyocera sees this as a major opportunity for its renewable energy and hydrogen-related business. The main business impact assessments results are depicted below.
| Category | Risks/opportunities | Change in operating profit | Reference materials and calculation methods | |
|---|---|---|---|---|
| 2.6°C scenario | 1.5°C scenario | |||
| Manufacturing/Services | Increase in Carbon Pricing | ▲10 billion yen | ▲12 billion yen | Assuming achievement of the 2030 reduction target using the IEA's World Energy Outlook 2024 as a reference. Calculation method: Future company greenhouse-gas emissions × Future carbon price |
| Increase in Energy Costs | ▲15 billion yen | ▲15 billion yen | Assuming achievement of the renewable energy target for 2030 using the IEA's World Energy Outlook 2024 as a reference. Calculation method: Future co-operative energy use×Renewable energy ratio (%)×2030 electric power unit price |
|
| Damage from Natural Disasters | ▲3 billion yen | ▲2 billion yen | Assuming that all domestic and overseas bases at high risk for potential flooding will be affected at some point by 2030 using the WWF Water Risk Filter, Aqueduct Flood, and Global Flood Depth-damage Functions as reference. Calculation method: Amount of damage to bases by region and industry × Site area × Flood depth-damage coefficient |
|
| Sales and consumption | Expansion of Energy Business | 0 billion yen | 6.5 - 8.5 billion yen (Results of Company-specific scenarios) |
Estimated using the IEA's EV Outlook 2022, the Renewable Energy Institute's Proposal for 2030 Energy Mix in Japan (First Edition), the WWF's Net Zero Emissions by 2050 Scenario, and METI's Strategic Energy Plan and Outlook for Energy Supply and Demand in FY2031 as reference. Calculation method: Sales Revenue by Related Businesses × Operating Profit Ratio×Market Expansion Ratio |
Reduction of Scope 1 and 2 Emissions
To facilitate the implementation of measures to reduce greenhouse gas emissions, we have divided the period from FY2020 to FY2031 into four phases, introduced visualization systems at each plant, implemented renewable energy, and thoroughly promoted energy conservation.
Looking at the implementation of renewable energy, we have achieved 20 times more than that of in FY2014, a goal that was set as one of our long-term environmental targets, ahead of schedule in FY2025. Moving forward, we will set a new target, "Share of Electricity from Renewable Energy Resources: RE60 by FY2031," and continue efforts in our domestic and international activities.
In addition, energy conservation is led by business divisions, and each division promotes activities with reduction targets.
| Stage 1 FY2020 to FY2022 |
Stage 2 FY2023 to FY2025 |
Stage 3 FY2026 to FY2028 |
Stage 4 FY2029 to FY2031 |
|
|---|---|---|---|---|
| Renewable Energy Introduction |
[On-site] Installation of solar power generation equipment at domestic and overseas affiliated companies |
|||
|
[Off-site] Installation of domestic solar power generation equipment (self-consignment) |
||||
|
[Off-site] Supply and demand of domestic renewable energy electricity (PPA) |
||||
| Energy efficiency promotion |
Introduction of waste heat recovery equipment
|
|||
|
Introduction of top-runner utility equipment
|
||||
|
Energy-efficient design and optimal operation of clean rooms |
||||
|
Energy visualization, improvement of production equipment efficiency |
||||
|
Shift away from petroleum fuels (conversion to natural gas, etc.), shift away from steam (electrification/water humidification) |
Study of hydrogen and ammonia utilization |
|||
New Renewable Energy Options
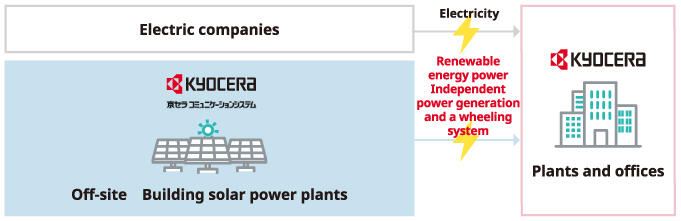
Since FY2021, the Kyocera Group expanded the use of renewable energy with the implementation of independent power generation and a wheeling system*1 using offsite solar power generation equipment. The Group also concluded a power purchase agreement (PPA)*2 involving renewable energy supply and demand (solar power, wind power, and biomass power generation). In addition, the Group has installed solar power generation systems on buildings and in parking lots at plants and offices both in Japan and overseas.
- Self-consignment allows power generated by a system owner to be supplied to other off-site users over the utility power grid.
- A power purchase agreement (PPA) allows users to benefit from renewable energy without having to own power-generating equipment
[On-site] Solar Power Installation
![images:[On-site] Solar Power Installation](images/img_tcfd_25_2_3.jpg)
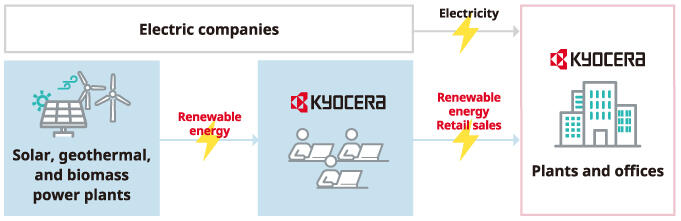
[Off-site] Expanding the installation and use of renewable energy
(1) Renewable energy power supply based on PPA
(2) Renewable energy power supply through an independent power generation and wheeling system
Expansion of RE100 Sites
In October 2024, Kyocera began an initiative to provide all renewable energy procured in-house to its headquarters in Kyoto. In addition, by the end of FY2026, we plan to replace 100% of our electricity use with renewable energy at a total of 10 sites, a move that is expected to reduce emissions equivalent to approximately 75,000 t-CO2 per year, which is roughly 15% of Kyocera's CO2 emissions.
RE100 Sites:Fukushima Koriyama Plant, Tokyo Hamura Office, Tokyo Ome Plant Yokohama Office 1st block, 2nd block (former Nakayama Office), Kawasaki Plant, Nagano Okaya Plant, Headquarters, Keihanna Research Center, Kagoshima Kirishima Plant Hayato Site
Promotion of Saving Energy
The Kyocera Group promotes energy conservation in facilities and buildings while taking into account of economic rationality at business sites and factories in Japan and overseas. Specifically, in addition to reducing waste through visualization, adopting and improving the operation of leading-edge utility equipment, and utilizing waste heat from equipment, we focus on improving production efficiency and improving yield throughout the production process.
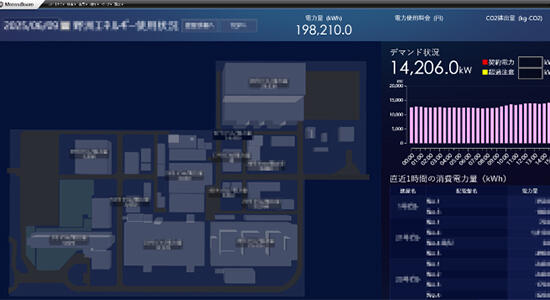
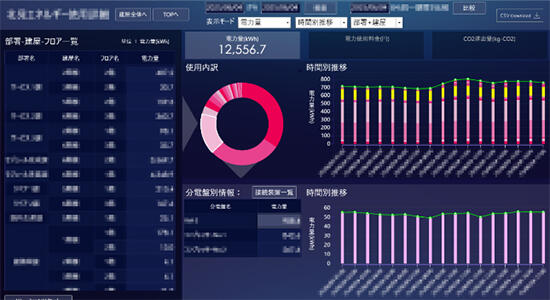
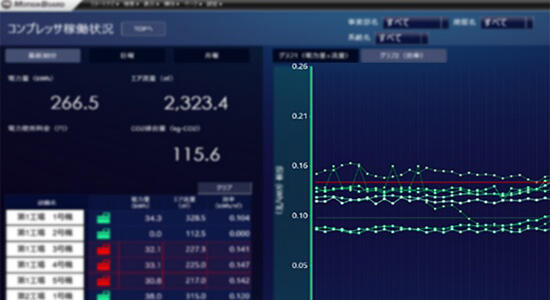
Promoting visualization of energy consumption
The Kyocera Group has been working on the visualization of an in-house system that shows energy consumption by building, floor, and equipment. This makes it possible for the Group to understand priority issues and achieve effective energy saving. In addition, for some utility equipment, we endeavor to prevent unexpected abnormalities and failures through an energy efficiency monitoring.
CO2 emissions reduction (estimated): 11,800 (t-CO2e/year)
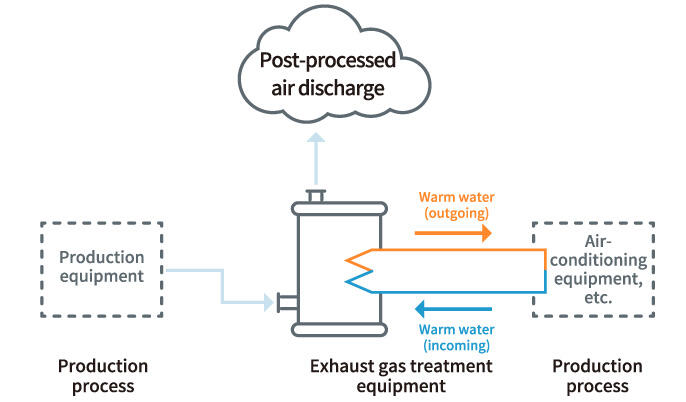
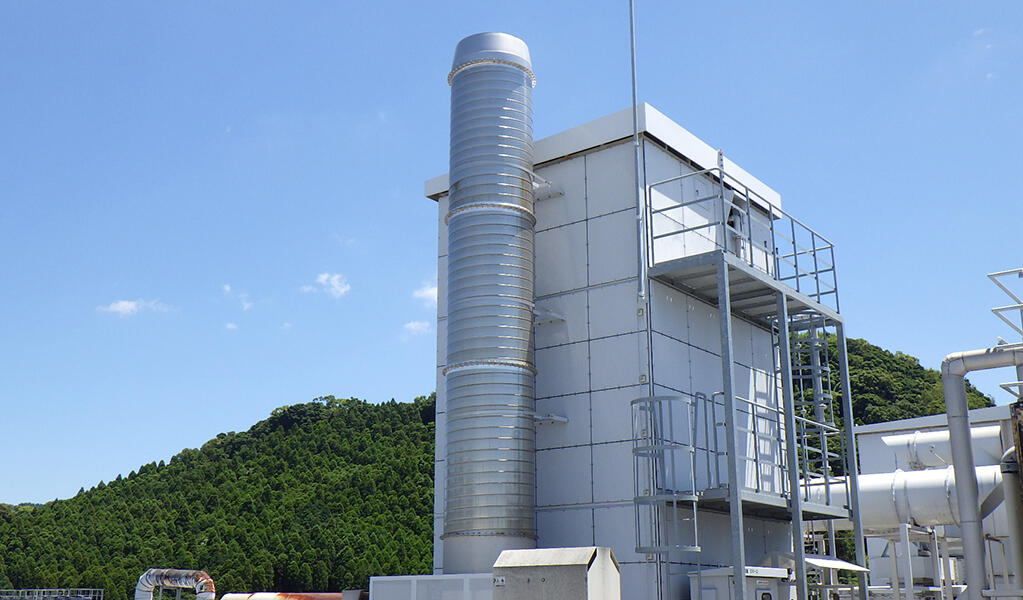
Waste heat recovery from exhaust gas treatment equipment
The Kyocera Group has installed exhaust gas treatment equipment in necessary areas to ensure that exhaust gases generated during production do not affect air quality or produce odors. And since the temperature of the exhaust gas is high, the heat is used to produce hot water, an operation that reduces use of the boiler to heat water in a separate process. We are now considering expanding this approach within the Kyocera Group in the future.
CO2 emissions reduction (estimated): 890 (t-CO2e/year)
Improving the efficiency of air cleaners
In addition to energy-saving activities covering production equipment, the Kyocera Group is expanding improvements to ancillary equipment. The air cleaners used for ceramic surfaces is a good example of these improvements. By using an inverter blower and developing a cleaner head that efficiently controls the airflow of injection and suction, we have reduced energy consumption by approximately 49%. We are now considering expanding this approach within the Kyocera Group in the future.
CO2 emissions reduction (estimated): 610 (t-CO2e/year)
Reduction of Scope 3 Emissions
Scope 3 emissions account for approximately 82% of the total GHG emissions by the Kyocera Group.
Emissions from Category 1 (Purchased Goods and Services) in particular account for a large portion. To address this, the Kyocera Group works on reduction through close cooperation with its suppliers.
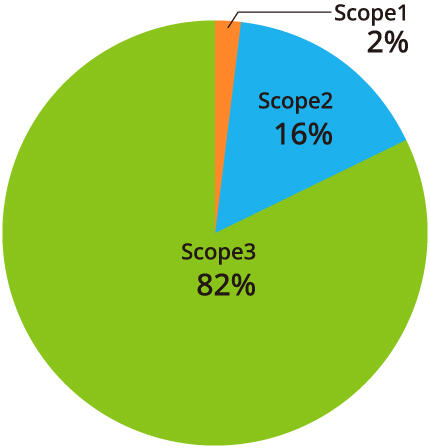

Category 10, 13, and 14 are not calculated because they are not subjects of the assessment.
Initiatives related to energy saving by contractors
Kyocera is promoting energy-saving initiatives at contractors that handle outsourced manufacturing.
In particular, we actively engage with contractors using Kyocera production equipment to ensure the most efficient operation and management.
Employee training
Kyocera has designated February, when energy demand increases, as Energy Conservation Month, and is implementing various initiatives.
One initiative implemented every year is the provision of education for all employees designed to raise awareness related to climate change.
Carbon Footprint Calculation
In response to European laws and regulations, and to better accommodate customer requirements, we are establishing and expanding internal carbon footprint calculation rules to more accurately determine CO2 emissions per product life cycle.
Natural Disaster Countermeasures
As part of our risk management efforts, the Kyocera Group assesses geographic variables in planning countermeasures to potential natural disasters. These include installing water barriers at facilities in flood-prone regions and assessing flood stage data during facility planning or expansion.
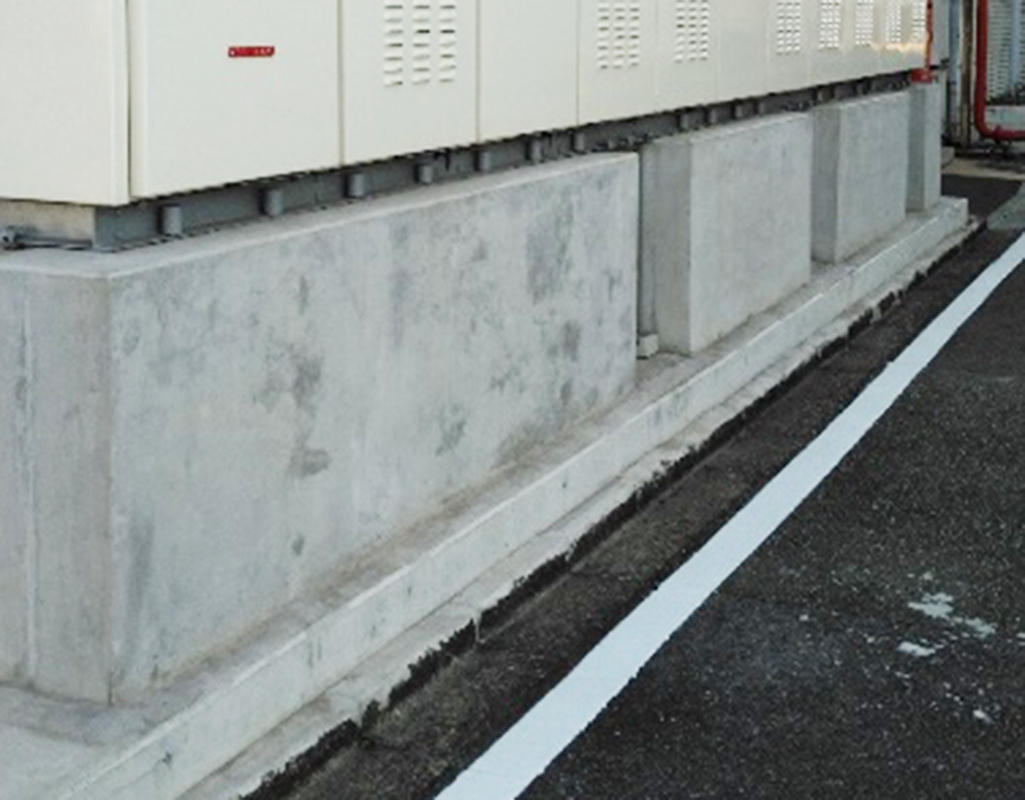
(Kawasaki Plant)
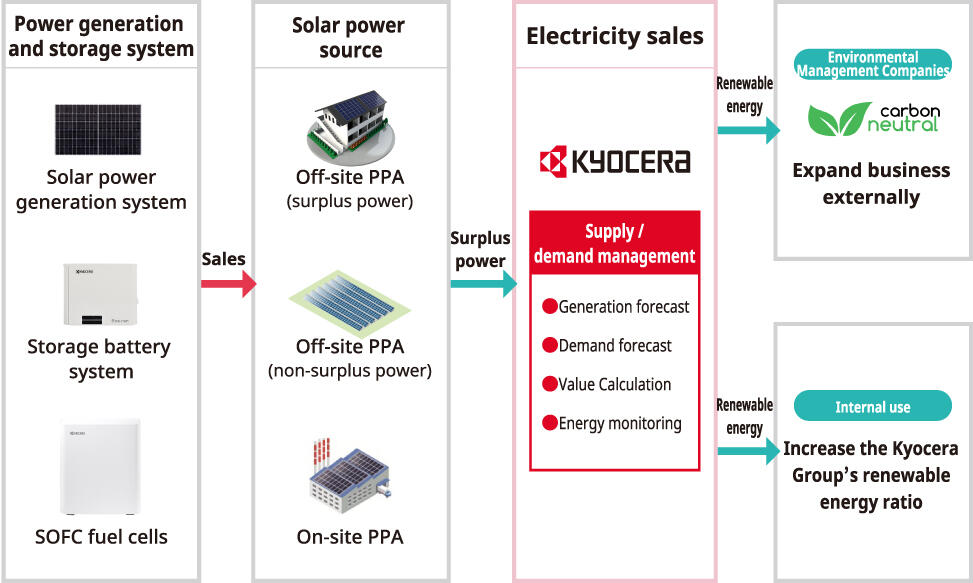
Expansion of Smart Energy Businesses
Kyocera is aggressively expanding its use of renewable energy resources internally. In addition, we are branching out externally with our Smart Energy businesses. This includes purchasing surplus power generated by homes, other businesses, and large-scale solar power plants, applying analytics to balance energy supply with demand, and selling the surplus renewable power to other users.
Risk Management
The Kyocera Group conducts scenario analysis on climate change to ascertain, assess, and manage risks and opportunities.
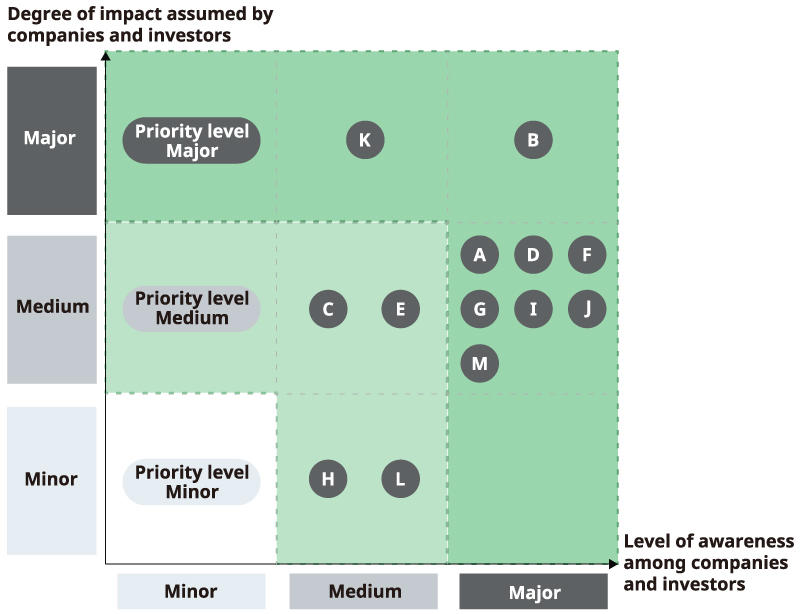
Risk Management Process
Our risk management efforts include identifying climate-related risks and opportunities within each value chain and evaluating them from two perspectives: 1) awareness level1, and 2) impact level 2. We then categorize each risk by priority: high, moderate, or low.
●Evaluated based on survey results of external trends from answers given by other companies to corporate assessments of climate change, policies addressing climate change, and other factors.
●Evaluated by external institutions based on the probability of an event occurring and its impact upon occurrence.
| Category | Items | Priority level | Summary of risks (●) and opportunities ( ) | Greatly impacted value chains | ||
|---|---|---|---|---|---|---|
| Transition risks | Policy | A | Carbon prices | Major |
|
Manufacturing / Development |
| B | Each country's carbon emission target | Major |
|
Manufacturing / Development Sales / Use |
||
| C | Energy-saving measures | Medium |
|
Manufacturing / Development | ||
| D | Subsidy policies for renewable energy and other initiatives | Major |
|
Manufacturing / Development Sales / Use |
||
| E | Regulations on recycling | Medium |
|
Manufacturing / Development Sales / Use |
||
| Technology | F | Increased adoption of next-generation electronic components and semiconductors | Major |
|
Manufacturing / Development Sales / Use |
|
| G | Increased adoption of next-generation technologies in energy-related business fields | Major |
|
Manufacturing / Development Sales / Use |
||
| Market/reputational changes | H | Changes in priority products/product pricing | Medium |
|
Procurement of raw materials | |
| I | Shift in consumer opinion in electronic components and semiconductors | Major |
|
Manufacturing / Development | ||
| J | Shift in consumer opinion in the energy business | Major |
|
Manufacturing / Development | ||
| K | Changes in investor/consumer opinion | Major |
|
All | ||
| Physical risks | Acute | L | Changes in precipitation patterns and rises in average temperature. | Medium |
|
Manufacturing / Development |
| Chronic | M | Intensifying extreme weather patterns | Major |
|
Manufacturing / Development | |
Metrics and Targets
The long-term targets set for the Kyocera Group are as follows. Greenhouse gas emission targets are certified SBT (Science Based Targets).
- Scope 1, 2*1, GHG emissions (1.5℃ level) : Reduce 46% by FY2031 compared to FY2020 levels
- Scope 1, 2*1, 3*2 GHG emissions (1.5℃ level) : Reduce 46% by FY2031 compared to FY2020 levels
- Share of Electricity from Renewable Energy Resources: RE60 by FY2031
- Carbon Neutrality: Achieve by FY2051
| *1 Scope 1: | Direct emissions associated with fuel consumption and production processes |
| Scope 2: | Indirect emissions associated with consumption of power or heat purchased from outside |
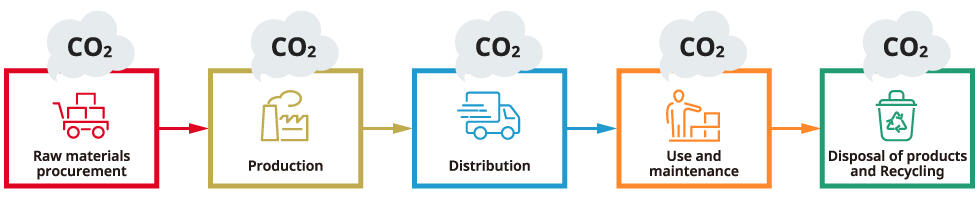
| *2 Scope 3: | Indirect emissions other than Scope 1 or 2 (Including procurement of raw materials, transport, use and disposal of products, as well as employee commuting and business trips) |
GHG Emissions (Scope 1, 2)

GHG Emissions (Scope 1, 2, 3)

Data have been updated to improve the accuracy of data aggregation for some locations.